Losses can carry across evaluation folds while the account remains below an earlier peak. Resetting the drawdown calculation at a fold boundary discards that high and can understate the loss on the linked path.
The account marks below are invented to illustrate drawdown accounting.
Define drawdown on an ordered path
For positive wealth Wt, including its initial value, define the running high-water mark and the maximum drawdown magnitude as:
D = maxt [1 − Wt / Ht].
Here drawdown is a positive fractional loss measured from the running peak. Two paths with the same terminal return can have different drawdowns.
Discrete account marks only reveal losses at their observation times. A deeper loss between marks, or the fill of a stop order, needs finer observations and execution assumptions.
A worked boundary example
Take two folds, each with an initial wealth mark normalised to one and two later marks. In a walk-forward study, fitting and selection would precede each evaluation period.
Fold A has normalised marks 1.00, 1.10, 1.04. Its return is +4%, and its largest drawdown is 1 − 1.04/1.10 = 5.4545%. Fold B starts afresh with marks 1.00, 0.98, 0.95. Its return is −5%, and its largest local drawdown is 5.0000%.
First rescale the marks onto one path. The account-state discussion below considers when that path can represent a funded account.
Fold A’s final mark and Fold B’s initial mark represent the same boundary wealth in this example. Both rows are retained to show the local-to-linked accounting; they are not two distinct moments.
Multiply every Fold B mark by Fold A’s terminal gross return, 1.04, to put both folds on the same scale. The linked reference peak remains 1.10: Fold B has not recovered the high reached in Fold A.
| Fold | Mark | Local normalised wealth | Linked wealth | Linked running peak | Linked drawdown |
|---|---|---|---|---|---|
| A | Initial | 1.0000 | 1.0000 | 1.0000 | 0.00% |
| A | Observation 1 | 1.1000 | 1.1000 | 1.1000 | 0.00% |
| A | Observation 2 (boundary) | 1.0400 | 1.0400 | 1.1000 | 5.45% |
| B | Initial (same boundary) | 1.0000 | 1.0400 | 1.1000 | 5.45% |
| B | Observation 1 | 0.9800 | 1.0192 | 1.1000 | 7.35% |
| B | Observation 2 | 0.9500 | 0.9880 | 1.1000 | 10.18% |
What happens to a peak at the fold boundary?
Keep the six accounting rows fixed. Change whether the reference peak resets or carries into the next fold.
The peak of 1.10 carries into Fold B. The final mark of 0.988 is 10.18% below it.
The six accounting rows come from the published CSV; the two boundary rows represent the same wealth. Local peaks are shown on the linked scale. Lines connect supplied marks and imply no observations between them.
Data and code
| Mark | Wealth | Reference peak | Drawdown |
|---|---|---|---|
| A start | 1.0000 | 1.0000 | 0.00% |
| A observation 1 | 1.1000 | 1.1000 | 0.00% |
| A observation 2 | 1.0400 | 1.1000 | 5.45% |
| B start | 1.0400 | 1.1000 | 5.45% |
| B observation 1 | 1.0192 | 1.1000 | 7.35% |
| B observation 2 | 0.9880 | 1.1000 | 10.18% |
Interactive values (JSON) Original figure inputs Reproduction script
Static figure and caption

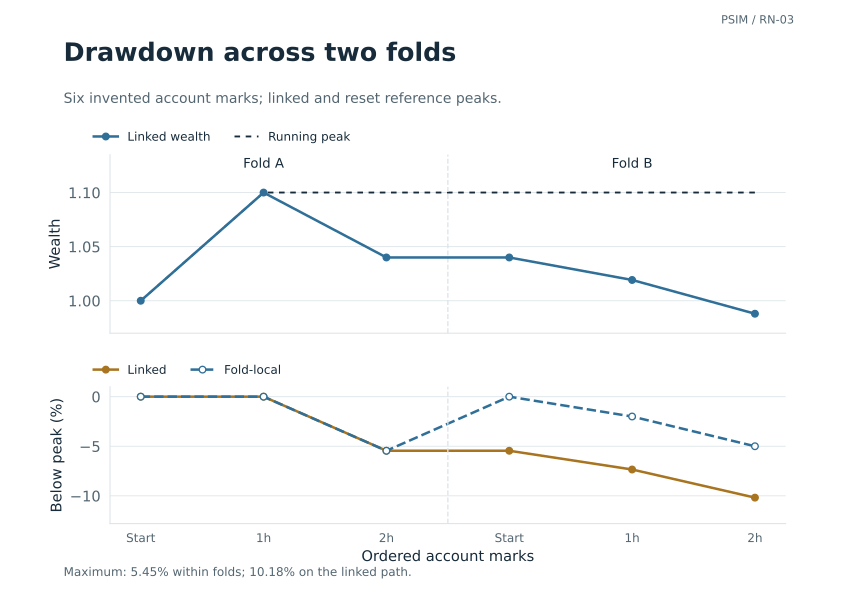
The linked return is 1.04 × 0.95 − 1 = −1.20%. The linked maximum drawdown is 1 − 0.988/1.10 = 10.1818%. Reporting the worst local drawdown, 5.4545%, as the linked result would understate this example's peak-to-trough loss by 4.7273 percentage points.
State the conditions behind the comparison
For positive fold paths scaled by preceding terminal gross returns, with the same observations and fold-start funding marks included, the linked drawdown is at least as large as the worst local drawdown. The linked running peak includes each local peak after rescaling, and can additionally include an unrecovered earlier peak.
If Fold A ends at its peak instead, with marks 1.00, 1.10, 1.10, while Fold B remains 1.00, 0.98, 0.95, both drawdowns are 5%. The linked and worst local values can therefore be equal.
For general fold f, normalised path xf,k and fold return Rf:
Wf,k = Afxf,k.
Concatenate the rescaled observations in fold order and apply one running maximum. External cash flows, overlapping folds, or a return definition that disagrees with the final mark require a different accounting treatment.
Preserve state and observation conventions
When an account has several marks at the same timestamp, a stable event sequence may be needed to preserve their order. A pre-trade valuation and a post-cost valuation can differ even though their timestamps match. Deduplication by timestamp can remove an economically relevant observation.
Funding, valuation frequency, event order, fees and fold boundaries all belong in the account specification. Carrying the earlier peak changes the drawdown measurement without adding a transaction loss.
A reset fold may start with fresh cash and no positions. Multiplying its returns carries none of the previous fold’s inventory, settlement obligations or financing. For the linked path to represent one account, those transitions must already be consistent in the returns or be included in an account replay.
Reproduce the example
- All constructed marks, linked wealth and drawdown, CSV
- Runnable examples using the Python standard library
- Arithmetic check results and scope
The script applies the running-peak definition to the printed six-mark example and the equality case. It needs no price data or strategy outputs.
Reproduce the figures
The figure script reproduces the charts from their published inputs. The figure data and checks record the inputs, seed and package versions.
python figures_v1.py --output-dir figuresRequires Python 3.10 or later, NumPy, SciPy and Matplotlib. Output: SVG and PNG in two layouts. Rendering varies with package versions; the supplied SVGs retain the published appearance.